
Last week, the 2016 M+R Benchmarks Study was released with an emphasis on what’s changed since 2006 when this study was first released.
Here are five key facts from this year’s study that would have been unthinkable just ten years ago:
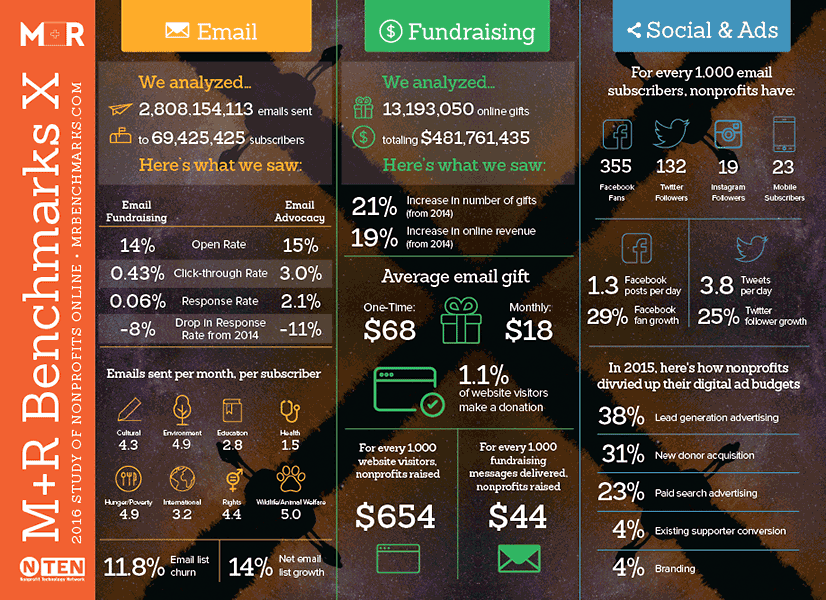
- Overall, 13% of online gifts were made from mobile devices – a number that likely reflects both user preference and increasing adoption of mobile optimization best practices by nonprofits.
- For every 1,000 email subscribers, nonprofits have 355 Facebook fans, 132 Twitter followers, and 19 Instagram followers. In 2006, those numbers were basically zero, zero, and zero.
- Nonprofits invested $0.04 in digital advertising for every $1 of online revenue. This might not seem like much, but considering that overall online revenue grew by 19% in the last year, digital advertising is an increasingly important market for acquisition, conversion, and retention.
- The volume has been turned way up: nonprofits sent the average subscriber 49 email messages in 2015.
- Monthly giving accounts for 17% of all online revenue – and monthly giving is growing quite a bit faster than one-time revenue. In our first Benchmarks Study, only about half of the participants had a recurring giving program at all.
Here are the key takeaways from the study in handy-dandy infographic form:
So beyond comparing your numbers to these, what else should you do with the data?
Reports like these are important for spotting overall trends and establishing a jumping-off point for discussions about your metrics, but your organization could be experiencing completely different results. So before you get too riled up that your social media growth isn’t as high as what’s shown in the study, start tracking your own numbers and see how they change over time.
And even more importantly, remember that metrics can tell you what is happening, but don’t tell you WHY it’s happening or whether IT MATTERS.
We encourage you to look at the trends and analysis in the report even more than the specific numbers. Think about the why behind those trends, as they relate to your organization, rather than getting mired in the data.
For example, the report shows that open rates, click-through rates, and response rates were down in 2015. BUT before you cry “Email is Dead,” email lists grew by 14% AND email revenue is up 25%. So, as the report says, it’s really just a matter of volume. Is your email volume going up? Why or why not?
Download your copy of the 2016 M+R Benchmarks Study now and then let us know how you use it to start conversations in your office.


