
In order to effectively use social media, you need to know how it’s used and who is using it. Let’s break down some important data about social media and specific channels like Facebook, TikTok, Instagram and more.
Social Media Demographics in General
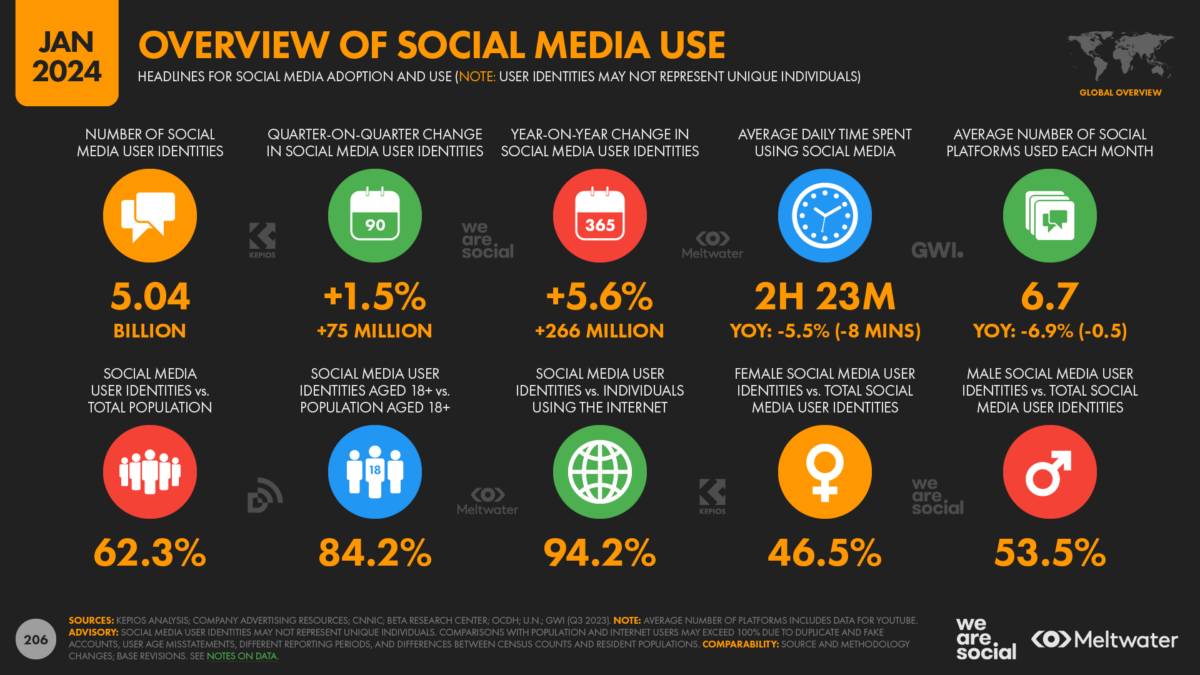
- The typical social media user actively uses an average of 6.7 different social platforms each month and spends an average of more than 2 hours and 23 minutes per day using social media
- Social media user identities have passed the 5 billion mark the equivalent to 62.3 percent of the world’s population
- There are 239.0 million social media users in the United States as of January 2024 (70.1 percent of the total population)
- Almost all nonprofits use social media in some capacity
- Number of monthly active users: 3.049 billion
- Number of active users in Northern America: 208.6 million
- Largest age group: 25-34 (29.6%)
- Gender: 43.2% female, 56.8% male (no data on other genders)
- Time spent per day: 30.8 minutes
- Number of monthly active users: 2 billion
- Number of active users in Northern America: 187.2 million
- Largest age group: 18-24 (32%)
- Gender: 49.4% female, 50.6% male (no data on other genders)
- Time spent per day: 33 minutes
TikTok
- Number of monthly active users: 1.562 billion
- TikTok’s advertising reach in Northern America: 127.4 million users aged 18 and above
- Largest age group: 18-24 (38.d%)
- Gender: 53.4% female, 46.6% male (no data on other genders)
- Time spent per day: 55.8 minutes per day
X (Formerly Twitter)
- Number of monthly active users: 372.9 million (down from 450 million)
- Number of active Twitter users in Northern America: 71.7 million
- Largest age group: 25-34 (38.5%)
- Gender: 35.7% female, 64.3% male (no data on other genders)
- Time spent per day: 31.4 minutes
YouTube
- Number of monthly active users: 2.5 billion
- YouTube’s advertising reach in Northern America: 279.1 million users
- Largest age group: 25-34 (20.7%)
- Gender: 45.6% female, 54.4% male (no data on other genders)
- Time spent per day: 48.7 minutes
- Number of monthly active users: 900 million
- Largest age group: 25-34 (60%)
- Gender: 43.7% female, 56.3% male (no data on other genders)
- Time spent per session: 7 minutes
If you want to learn more about social media, keep an eye on our Live Webinar and Workshop schedule for upcoming training opportunities. We have resources and discussions happening in our private community right now! Not a member of our community? Join now! It’s free.
Sources:
https://datareportal.com/social-media-users
https://www.mixbloom.com/resources/average-time-spent-on-social-media-2022
https://datareportal.com/reports/digital-2024-united-states-of-america
https://wearesocial.com/us/blog/2024/01/digital-2024-5-billion-social-media-users/


