Guest Post by Julia Reich of Julia Reich Design
Here, There, Everywhere
Nonprofits are using infographics in a multitude of ways, such as in annual reports & newsletters (both online and in print), to accompany a blog post, or as stand-alone item.
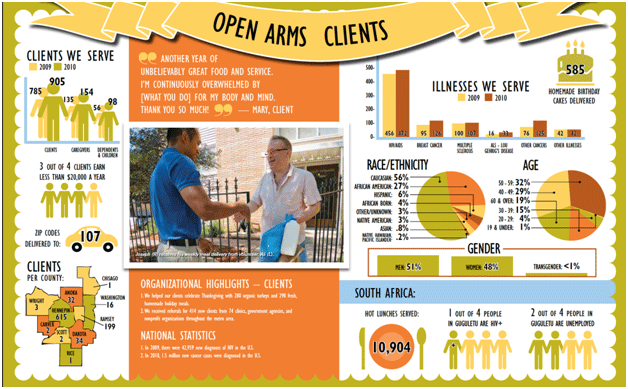
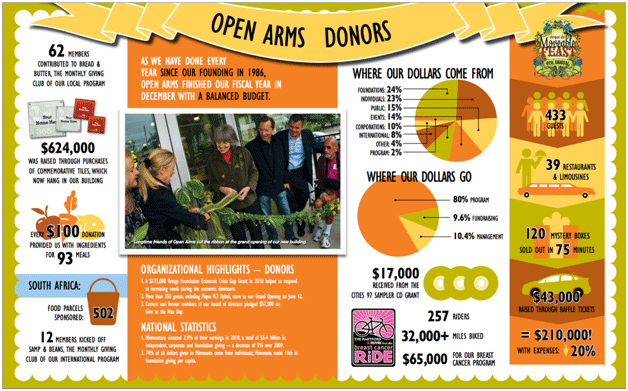
The creative team at Open Arms of Minnesota, which includes creative director Kelly McManus and communications director Susan Pagani, created several infographics for their 2010 Annual Report. Open Arms cooks and delivers free, nutritious meals to people living with chronic and life threatening disease in the Twin Cities metro area.
McManus says using infographics throughout the annual report — a page in each section, including donors, clients and volunteers — was part of a strategic decision to provide more transparency and clarity. “We wanted it to be more accessible to everyone – not just those who read the entire report cover to cover. Before, it was onerous to read. We had done a lot of interviews with donors and clients and we wanted to differentiate this one to show how much we did this past year. This has brought a level of fun to it.”
McManus says they made the annual report more engaging by mixing up the serious statistics that are required to be reported, with more fun, quirky facts – such as how many cookies were baked, or noting that flip-flops are not allowed in the kitchen. This warm, welcoming approach and design style reinforces their voice as well. “Our way of being Open Arms really is built on love and joy,” they note.
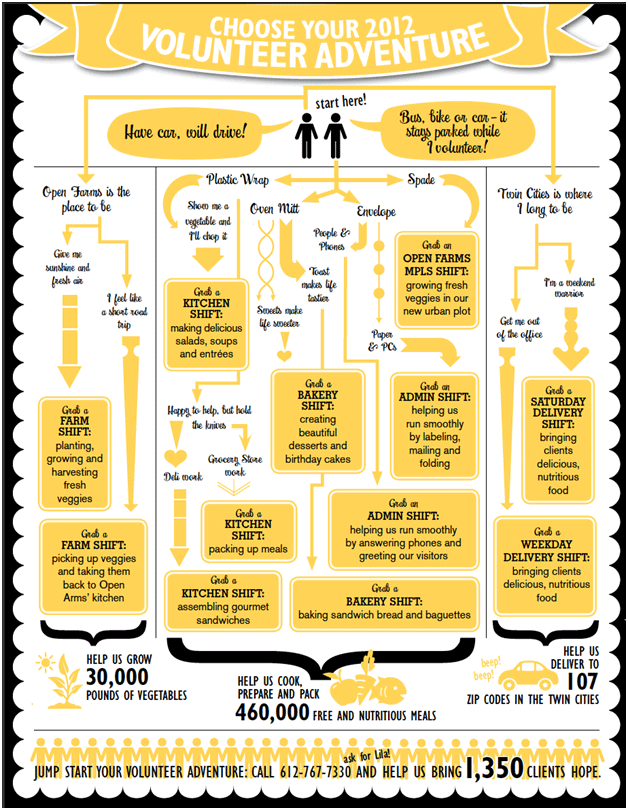
Now their innovative efforts are starting to trickle into other organizational communications – such as in the spring 2012 issue of their newsletter, Scoop, which devotes a page to a fun flow chart, “Choose Your Own 2012 Volunteer Adventure”:
And at my firm, lately we’ve been busy developing infographics that help nonprofit leaders present annual reporting information to their boards and membership as an alternative to ho-hum PowerPoint slides.
Coming tomorrow: Getting started with infographics, with DIY tips and tools.
Julia Reich is principal of Julia Reich Design, which helps nonprofit organizations bring their mission to life with award-winning brand strategy, graphic design, and web design services. Clients love her team’s top-notch creative work combined with an affordable, personalized approach.
