
On January 3, 2011, I started a daily blogging experiment — and by “daily” I actually meant business daily, Monday – Friday. (Katya Andresen did the same thing, but really did blog every day, including weekends. Here’s what she learned about her 100 posts.)
Out of the 64 business days between Monday, January 3 and Thursday, March 31, I actually posted 58 times, missing one day in January, none in February, and five dates in March. I remember each date I didn’t post, and reasons/excuses include a computer meltdown, travel, a miscommunication with my assistant, and just plain forgetting.
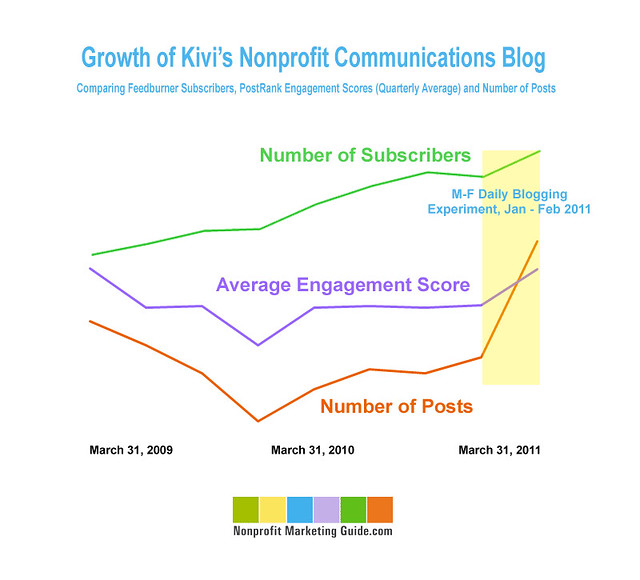
Let’s take a look at the data first . . .
I’ve plotted the trend lines for the number of blog subscribers (according to Feedburner), engagement (averaged over the quarter using PostRank Analytics), and number of posts. Each data point was collected at the end of the quarter, starting March 31, 2009 and ending March 31, 2011, creating nine data points with this January – March highlighted in yellow.
 As you can see, daily blogging helped increase both the number of subscribers and the post engagement, which includes commenting and social media sharing. The rate of increase on both of those measures is very strong, especially since they had both leveled off last fall.
Subscribers
A few people were concerned that daily blogging would reduce subscribers, but it actually increased over those three months by 11.3%. The only other time the subscriber rate grew that fast was the first quarter of 2010. In the last quarter of 2009, I was only posting about once a week. Posting twice a week in the first quarter of 2010 increased subscribers by 15%.
I’ll admit that I was concerned too, and to mitigate that, I made it very clear that people could subscribe to my weekly e-newsletter instead, where I would include a roundup of the previous week’s posts. I provide this option in several places, including the subscription box and in a footer that goes out with the RSS feed. I know some people switched, but it wasn’t that many.
Traffic and Referrals
Comparing January-March 2011 to the previous quarter of September-December of 2010 (when I blogged about 2-3 times a week), visits increased by 30% and pageviews increased by 35%, according to Google Analytics. Twitter referrals increased 149% and Facebook referrals increased 138%.
Looking at a year-over-year comparison of January-March 2010 (when I was blogging twice a week) to 2011 (blogging five times a week) in Google Analytics, visits increased 116% and pageviews increased 91%. Twitter referrals increased 275% and Facebook referrals increased 160%.
Bottom Line: Blogging More = More Subscribers, More Engagement, More Traffic, and More Referrals
Now let’s look at why I really did it . . .
I decided to try M-F blogging because I love to write, and because I thought writing that often would challenge me to think bigger and harder about how I can help solve communications and marketing problems that small nonprofits are facing. I feel really good about the quality of the posts overall, and the experience has definitely helped me see where I can contribute best to the conversations in our field, while also helping me hone what I’m doing in the webinar series and with several e-books that are in the works.
Bottom Line: Blogging More = More Professional Satisfaction
Monday-Friday blogging has been a great experience for me, and the data supports continuing, which is what I plan to do. We’ll see how the next three months compare to these first three. If you are looking for fresh nonprofit marketing advice on the weekends, however, you’ll have to pop on over to Katya’s blog!


